Seven audit dimensions
A reusable taxonomy turns questions about users into evidence that can be measured or inspected.
Auditing evaluation resources
A user-centric framework for auditing evaluation resources
University of Alberta
Benchmark scores depend on choices about language, geography, reference answers, and scoring rules. WhoseBench distinguishes source users, whose content and judgments shape a resource, from target users, whose needs and contexts its results are intended to inform.
The study audits 11 text benchmarks and five image-text resources. Its three empirical analyses connect conventions in benchmark content, country visibility in textual metadata, and the user assumptions made inspectable by public documentation.
A reusable taxonomy turns questions about users into evidence that can be measured or inspected.
Content, scoring, geography, and documentation are examined across 16 resources.
Six documentation fields help creators state the scope and assumptions of evaluation claims.
The framework links what a resource contains, where its content comes from, how answers are scored, and which user contexts its scores are meant to represent.
| Dimension | What the audit asks | Evidence examined |
|---|---|---|
| Linguistic and locale conventions | Which forms are treated as default? | Spelling, dates, time, and units |
| Geographic visibility | Which countries are visible? | Country references in captions and metadata |
| Socioeconomic structure | What relates to country visibility? | GDP, population, Internet use, tourism |
| Source-user context | Where does content originate? | Platforms, institutions, provenance fields |
| Target-user assumptions | Whose settings can scores inform? | Intended users, settings, evaluation claims |
| Annotator visibility | Whose judgments define labels? | Expertise, locale, recruitment, protocols |
| Evaluation normalization | Are valid alternatives accepted? | Scoring rules and paired answer tests |
Across 11 text benchmarks, American-centered forms account for 62.4% to 94.4% of matched spelling, date, time, and measurement signals. This is a share among detected signals; it is not the share of all benchmark items. The paper separately reports signal coverage, which ranges from 5.97% of WinoGrande items to 78.08% of DROP items.
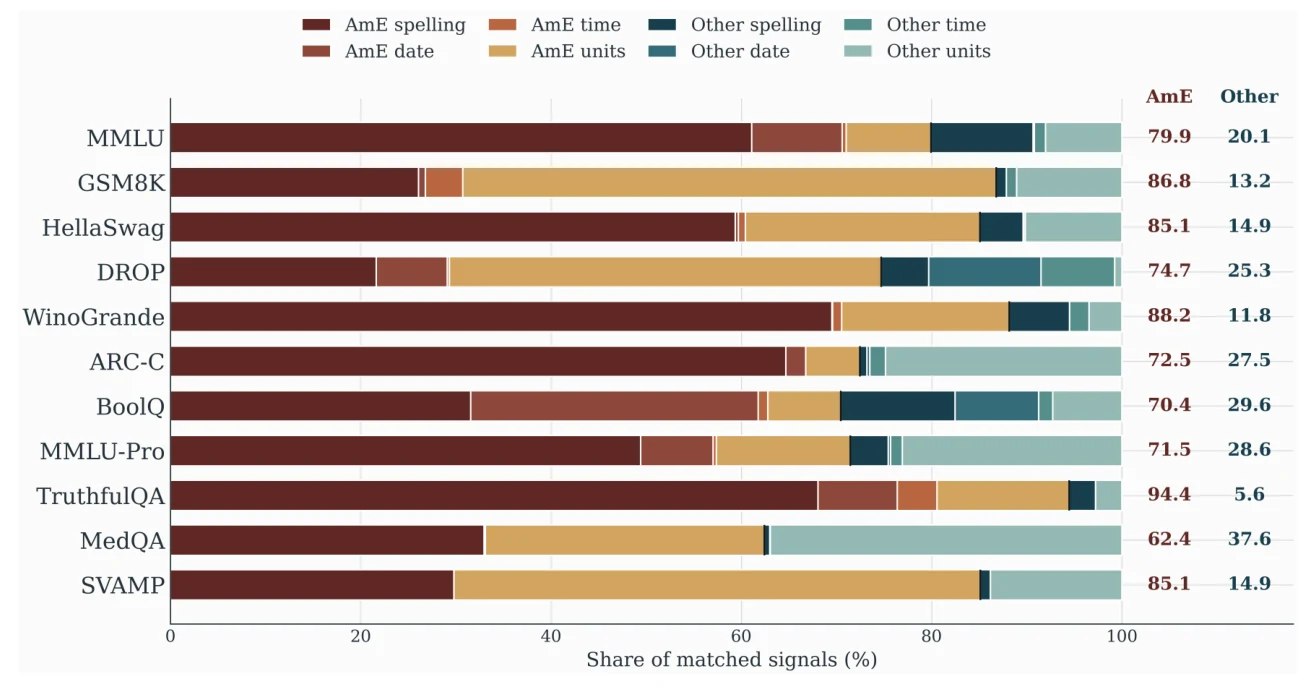
Excluding spelling leaves an American-centered majority in eight of the 11 resources. This shows that the pattern is not limited to orthography, while ARC-Challenge, MedQA, and MMLU-Pro have different non-spelling profiles.
| Benchmark | Items with a signal | American-centered share, excluding spelling |
|---|---|---|
| MMLU | 26.60% | 66.9% |
| GSM8K | 25.40% | 83.3% |
| HellaSwag | 38.11% | 71.2% |
| DROP | 78.08% | 72.3% |
| WinoGrande | 5.97% | 77.2% |
| ARC-Challenge | 18.73% | 22.5% |
| BoolQ | 44.92% | 68.9% |
| MMLU-Pro | 37.80% | 47.3% |
| TruthfulQA | 7.59% | 90.5% |
| MedQA | 65.85% | 44.3% |
| SVAMP | 9.30% | 80.0% |
Paired tests compare reference-consistent answers with meaning-preserving spelling, date, or time variants under the same scoring rules. The largest change occurs in DROP exact match; TruthfulQA's reference-ranking measures behave differently.
| Benchmark | Measure | Original | Variant | Change | 95% CI for change |
|---|---|---|---|---|---|
| DROP | Exact match | 100.0 | 33.3 | −66.7 | [−92.3, −36.4] |
| DROP | Token F1 | 100.0 | 77.2 | −22.8 | [−41.6, −5.2] |
| TruthfulQA | BLEU correctness | 97.0 | 97.0 | 0.0 | [0.0, 0.0] |
| TruthfulQA | ROUGE-1 correctness | 97.0 | 97.0 | 0.0 | [0.0, 0.0] |
| TruthfulQA | ROUGE-2 correctness | 100.0 | 93.9 | −6.1 | [−16.1, 0.0] |
| TruthfulQA | ROUGE-1 similarity | 100.0 | 88.9 | −11.1 | [−13.5, −9.0] |
Confidence intervals use question-clustered bootstrap resampling. These tests measure scorer sensitivity to valid answer expression, not model accuracy.
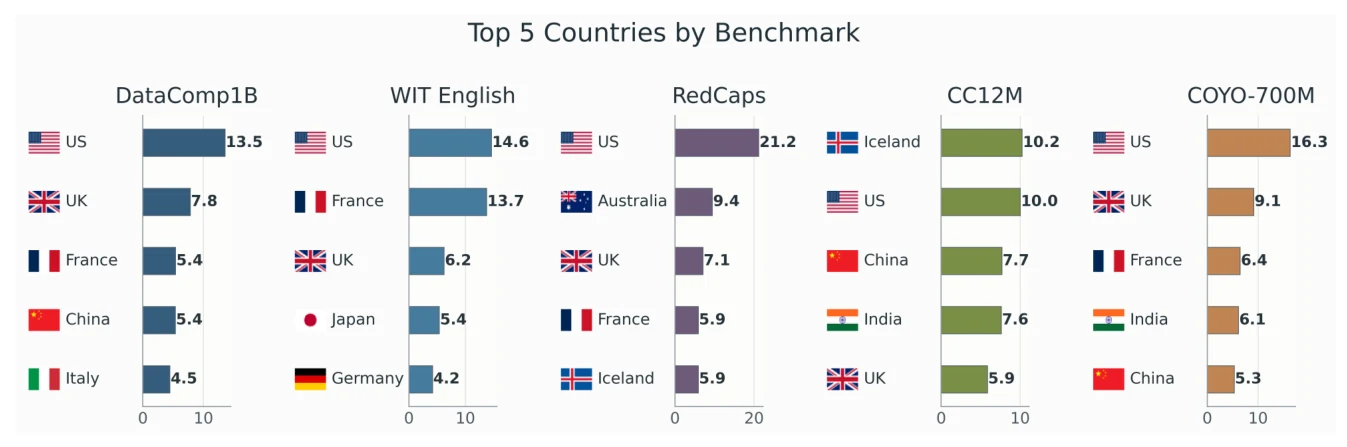
The study identifies explicit country references in captions and associated text from DataComp1B, WIT English, RedCaps, CC12M, and COYO-700M. Among records assigned uniquely to a country, the United States leads four resources; Iceland leads CC12M. The top three countries account for 26.8% to 37.6% of resolved assignments.
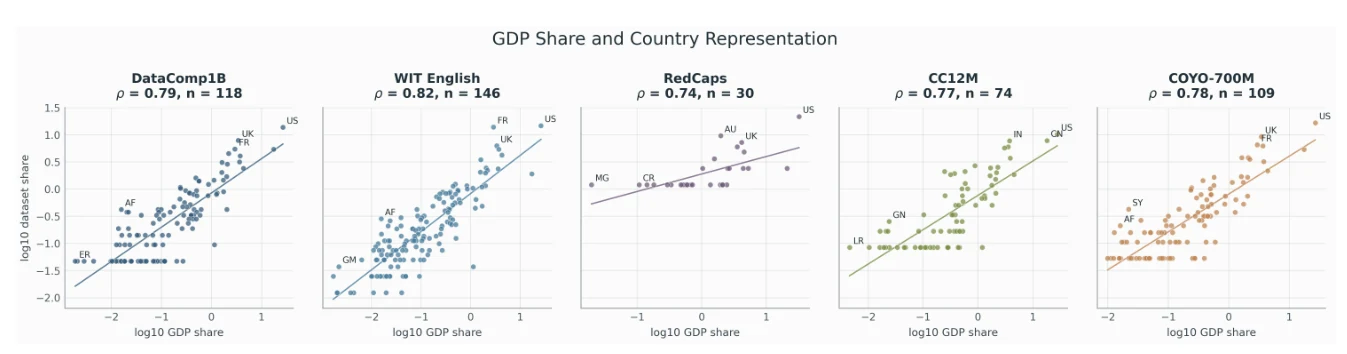
Country visibility is strongly associated with national GDP share across the five resources (mean Pearson r = 0.780; mean Spearman ρ = 0.778). In a separate balanced WIT comparison, the US share falls from 20.0% for English to 8.5% for non-English text, while GDP associations persist.
Two annotators assessed public papers, dataset cards, and repositories for all 16 resources. Each criterion was scored as absent (0), explicitly mentioned (1), or operationalized through inspectable evidence (2). All 16 resources operationalize source-user context, but none operationalize target-user context.
| Criterion | Mean / 2 | Mentioned | Operationalized |
|---|---|---|---|
| Source-user context | 2.00 | 100.0% | 100.0% |
| Target-user / evaluation context | 1.00 | 100.0% | 0.0% |
| Annotator visibility | 0.56 | 56.2% | 0.0% |
| Locale assumptions | 0.31 | 25.0% | 6.2% |
| Evaluation normalization | 1.44 | 75.0% | 68.8% |
| Source / geographic metadata | 0.69 | 37.5% | 31.2% |
“Mentioned” includes criteria scored 1 or 2; “operationalized” includes those scored 2.
The paper translates the audit into a minimal reporting checklist that benchmark creators can apply and benchmark users can inspect.
Reading the evidence. The convention detector covers selected observable forms, country visibility is based on explicit textual references, and the documentation scores describe released materials. These measurements help define what the audited resources support.